HOME DEPOT STOCK [$HD] BOUNCE PLAY
One of the most helpful things that anybody can learn is to give up trying to catch the last eighth—or the first. These two are the most expensive eighths in the world.
– Edwin Lefèvre, Reminiscences of a Stock Operator
Spotting Reversals for “Oversold” Bounce Plays!
One of my favourite trade setups is an oversold bounce play! This week Home Depot ($HD) set up beautifully for such a trade. I had been stalking the $HD chart the previous week waiting for the setup to develop into a high probability trade. In this week’s blog post, I’m going to show you all of the factors I considered going into this trade, how I traded it from start to finish and a critique of my own trade and what I could have done better! This was also an official AoT trade alert! I’m sure many of the members of this awesome community enjoyed this trade as well!
Calling tops and calling bottoms is a very dangerous thing to do in the market, so when I take a trade such as $HD there are many factors that must line up for me to fully commit to the position. Here are the following items I check off the list before I commit to the trade.
- Is the stock still respecting its upward trending support?
- Is the stock at or near a big area of previous MAJOR resistance?
- Has the volume on the down days slowly started to dwindle down?
- Is there a technical setup emerging on the chart? (falling wedge)
- Was the previous days trading range nearly flat or muted?
- If I enter this trade can I put on a reasonable stop that will allow the trade to breath but at the same time responsibly protect capital if the trade quickly goes against me?
Let’s analyse all of these questions one by one!
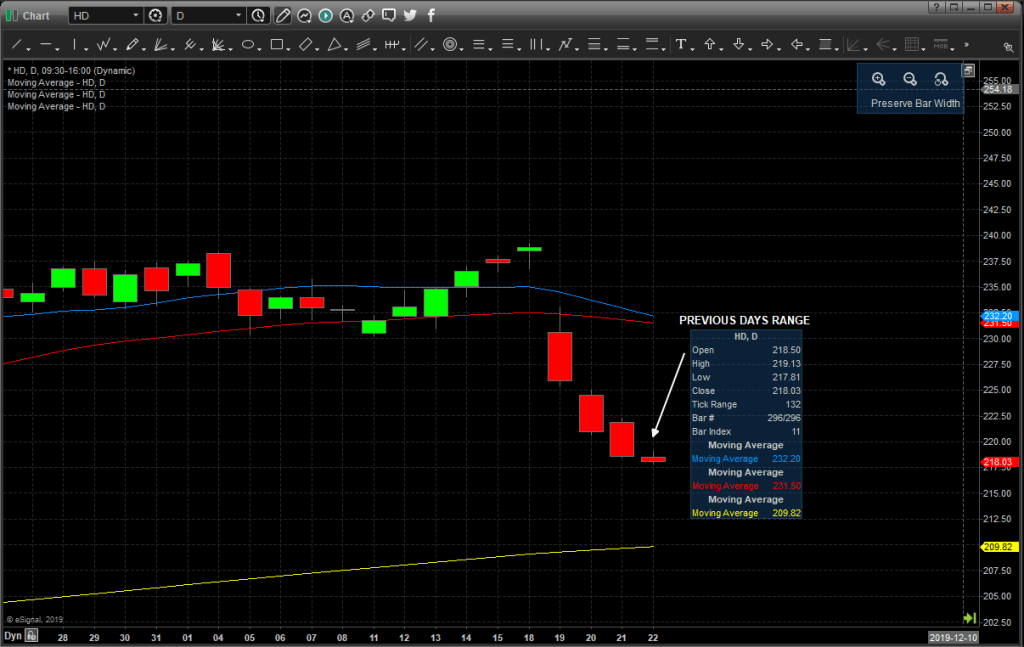
- $HD Daily chart – Is it respecting major uptrend support? YES!

- $HD Daily chart – Is the stock at or near a big area of previous MAJOR resistance? YES!

- $HD Daily chart – Has the volume on the down days slowly started to dwindle down? YES!

- $HD Daily chart – Is there a technical setup emerging on the chart? YES!

- $HD Daily Chart – Was the previous days trading range near flat or muted? YES!
- If I enter this trade can I put on a reasonable stop that will allow the trade to breath but at the same time responsibly protect capital if the trade quickly goes against me?
For trades like this I generally scale into the trade. I start by putting on a half size position and then when I’m sure that a reversal might take place, I add to a full-size position. My stops are usually about a 1% risk from my entry. In this trades case I had an average entry around $217.80 and my stop was a respectable $215.
With this information at hand you might ask: What triggered your entry into the stock and how did you scale into the trade? Let’s take a look at the process behind the entry!
The Entry!
I like to use 5-minute time frame charts to enter stocks. I think they provide all the confirmation a trader needs to enter a swing trading position! A few factors I considered when entering the trade were:
- Did the stock open down (red)? Is it starting to reverse? (Red 2 Green setup)
- Upon the reversal did the stock see a BIG spike in unusual volume?
In this case $HD did! Let’s look at the point in which I entered this trade!
$HD 5 Minute Chart – Big Volume Reversal (2019-11-25):
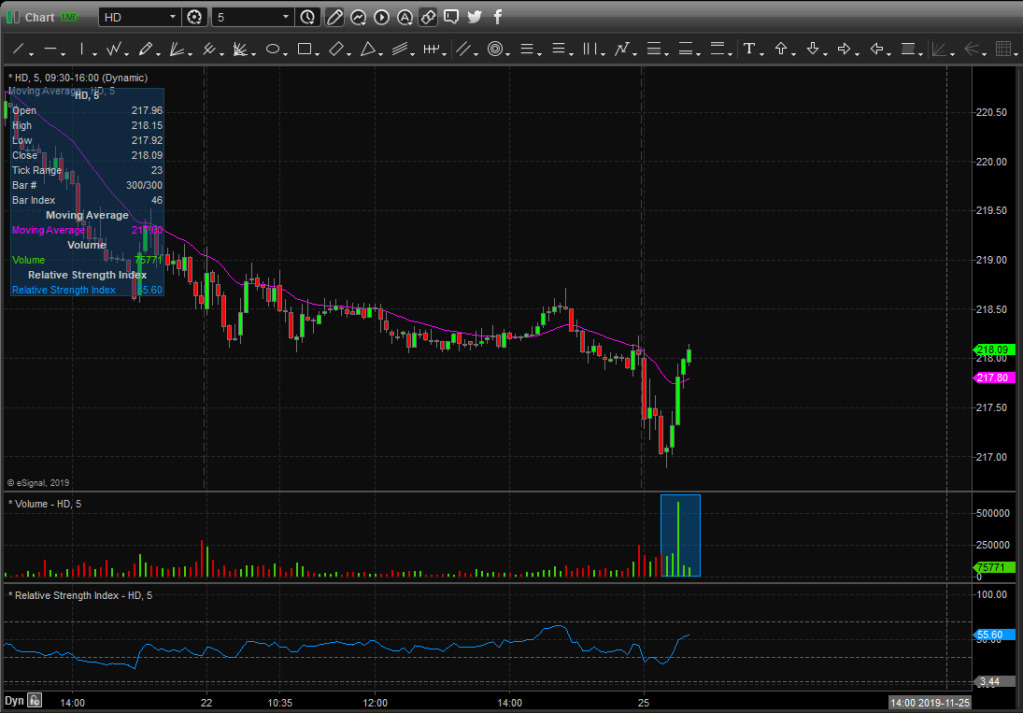
The stock opened red, sold off the first 30minutes of the day and then a massive spike of volume (500k+ shares!) the stock reverses and goes green 15minutes later!!! Remember some of the best trades are ones that open RED and go GREEN! I took a half size position at this point and set my stop at $215! Here is a screenshot of my first entry here:
First Entry $HD Stock:

After entering the first position in the stock, I put in a second small size limit order for when the stock went green! I wanted to scale into this stock fast on any signs of a reversal. Here is the second entry for when $HD went green!
Second Entry $HD Stock:

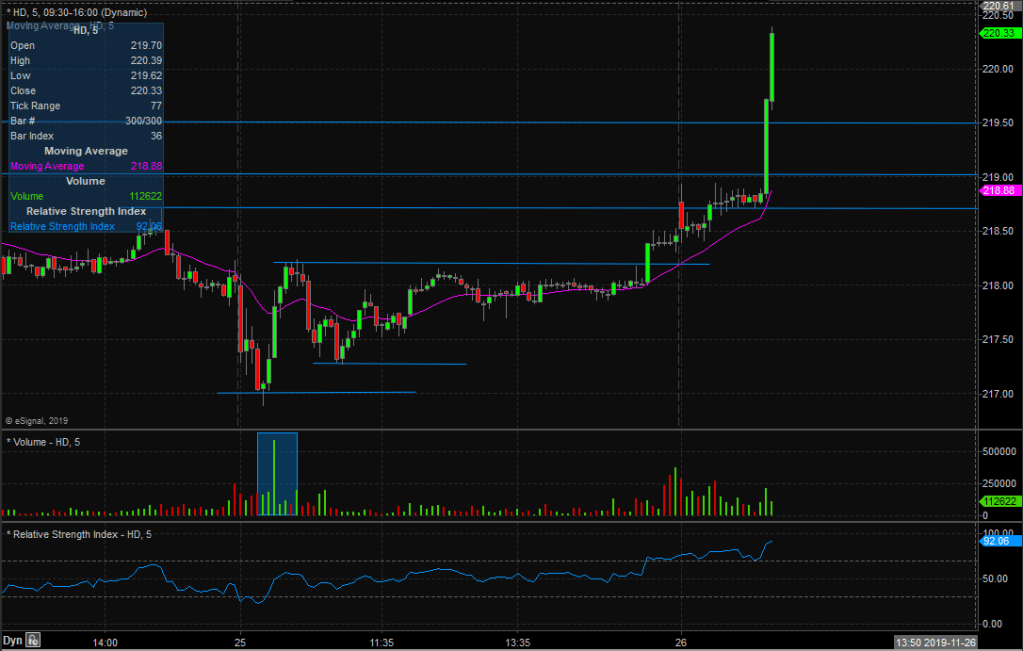
As the day progressed so did the chart, in this next chart, we will see how the stock puts in a higher low!
$HD 5 Minute – Chart higher low (2019-11-25):

At this point I had bought the 3rd and final piece of my position! I was quite confident in this trade so I sized accordingly. Admittedly I could have waited for a bit more confirmation on the higher low.
Third Entry $HD Stock:

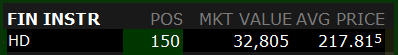
At this point I was fully scaled into the trade with 150 shares with a cost average around $217.81. Seen here:
So, what is the next step to this type of trade?
First, I take a look at my overall target! I’m generally not concerned with making money at the start of the trade, my main concern is protecting capital. But as many traders know, you have to have an exit strategy on both sides of the trade whether you’re getting stopped out or capturing a gain. My target on this trade was around $225ish – $226ish range. I actually posted a chart on the Sunday night before (2019-11-24) stating that I was interested in this trade. I had already mapped out levels on that daily time frame using Trendspider Charting Solutions! Click the link to see the chart and levels below!
$HD Daily Chart – Chart Requests Trade idea (2019-11-24):

A link to that thread can be found here! https://twitter.com/87AlwaysRed/status/1198802215265275904
The next step to my trading strategy is to start mapping out more precise levels on the 5minute time frame chart. The reason I do this is because I want to see how the stock reacts at certain “BIG” levels. The second, and frankly the most important reason is because I want to potentially use these levels as future stops on my position! I want to plan a strategic exit before its to late. Keep in mind you must be careful with this sort of strategy though. If your position size is too big you might have a tendency to take the position off early! Let’s take a look at the levels I mapped out!
Keep in mind I mapped these levels out before the stock actually ended up at these points. I use these levels to manage the trade! I use multiple time frames 15min / 30min to find these areas and map them out. Here are 4 charts I posted live throughout the $HD trade:
$HD 5 Minute Chart – Levels 1:
$HD 5 Minute Chart – Levels 2:

$HD 5 Minute Chart – Levels 3:

$HD 5 Minute Chart – Levels 4:

As you can see this trade is following technical levels very nicely! I’m watching the volume levels very closely as the trade progresses! Also if you go back to the daily charts you will notice $HD put a mini hammer reversal in with continuation to the upside on Tuesday!
Ok, so now what? A very important rule I have is to never close a green trade red! So, lets get on to how I exited this trade!
The Exit!
On Tuesday I had raised my stop to the break-even area after the stock closed above $220. My stop at this point was $217.50ish. I was giving this trade approximately a 1% move the whole way up.
Wednesday was the important day though! Premarket the stock was trading at $222.50ish! I knew we were in for a gap up open so this is when I needed to watch close! I raised my stop to $220.50 after the first 30 minutes of the day. As you can see in the previous chart $HD didn’t go below the previous close. It reversed and push into highs of the day before the FIRST HOUR OF TRADING! This is a very bullish sign!!!
At this point $HD pushes higher fast! Pushing into the $222.50 range! I’m planning my exit! Why you might ask? Well here is why I exited the stock when I did:
- The stock was pushing into premarket highs – Possible spot for resistance.
- We were trading a short week! Volume started to become muted.
- Unlike the day before $HDs volume wasn’t as impressive.
- I was nearly 2:1 on the trade! It never hurts to lock in profits
Lets take a look at the exit chart!

I took the trade off at $222.20 for $4.40 a share or a $660 USD gain. I’m a Canadian trader so I banked $875~ CAD after the currency conversion!
EXIT:

Why did I take the trade off when I did?
- I was within 1% of my target! My Stop loss was 1% lower. At this point it really didn’t make sense to risk 1% to make 1% I was better off just capturing the gain!
- It was a short week in the market! NEVER TRUST A SHORT WEEK IN THE MARKET!
What could I have done better?
- On the entry I should have waited for a bit more confirmation on the higher low!
- On the exit I should have used the clear trendline it was following to capture more of the gain.
Thanks for taking the time to read how I executed this awesome trade! I hope this post gives you a little more insight as to how I handle my positions as a trader! Happy trading!!!

Lovely blog post, Zach!!
I love the detailed STEP BY STEP educational posts!! All traders love these kinds of posts actually!!
Keep up the great work, my man!!
LikeLiked by 1 person
Thanks Stewie! Awesome alert by you as well!
LikeLike
Nicely done. Thank you for posting
LikeLiked by 1 person
Very well executed trade. You followed your trade plan methodically and explained elegantly. Congratulations on winning the trade. Well done.
LikeLiked by 1 person
You really like exclamation points !
LikeLiked by 1 person
I do! I also really like trading. The markets really excite me day in and day out. I try to portray that in my blog posts!
LikeLike
Excellent trade and Excellent detailed explanation of the trade.
Timing, Money Management and Emotions.
Love the Edwin Lefèvre quote!
LikeLike
THANK YOU FOR SHARING SIR.
LikeLike