Featured

How I made a 114% return in 2021

A Break Down of the Year and a Closer Look at My Trading Strategy

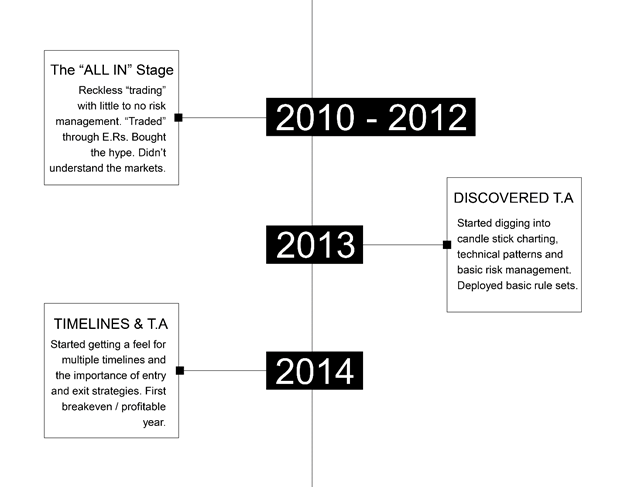
                I Figure that this would be a great place to talk about my 2021 year in the market. From a yearly percentage return perspective this has been a personal best for me! I’ve been actively involved in the markets since late 2009 / early 2010 and since then I’ve been continuously honing and improving upon what defines me as a trader.

Previous to joining the Art of Trading I had tried a few other services with not much success. What I was really seeking was a mentor of sorts. the Art of Trading ended up being what I was looking for. The reason I wanted to join was because I had already spent so much time on my own looking at one angle of the market that I thought it would be more productive if I was able to mimic the style of someone else and build off of it. My end goal was to be able to take everything I liked about Trader Stewie’s swing trading, and mesh it into my day trading style, then eventually create a hybrid style of sorts. I wanted to create a strategy that worked well in a variety of market conditions. I was able to achieve this with his hands on approach and his willingness to help!

In 2020 I wrote a post, here on my blog titled “Multiple Perspectives – The Art of Trading: How the Art of Trading Facilitated my Growth as a Trader!” I think its very important to revisit this post because a lot of what is contained in that post is still relevant today. 2022 will be my 4th year as a member in the Art of Trading, and a major part of my success comes from here. The development of my strategy consists of bits and pieces of Trader Stewie’s strategies plus strategies that I have worked on over the years and built myself.

For the first time I would like to share the strategy that I have developed and how I was able to return 114%+ in 2021!

What does my strategy look like, what are the rules and how does it work?

I like to call my trading strategy the Stair Trading Strategy (S.T.S). The strategy in its best form uses the power of swing trading combined with day trading. It is built around taking day trading profits defined by a dollar value from the market on a daily basis. The primary purpose of the day trading profits in trending markets is used to manage risk on open swing trading positions and at the same time reduce over night exposure risk. In higher volatility markets without a clearly defined trend or markets with heightened over night risk the swing trading aspect of the strategy is turned off, and the primary focus becomes day trading.

Each day I come into the market I’m looking to build steps. The best way to picture this strategy is a set of stairs that you’re trying to build. Each step is a defined dollar value based on the account size. The steps define risk for both the swing trading and day trading strategies.

Here is the defined risk for the day trading strategies:

1 Step = 0.25% of the total account value.

1 Step also equals your maximum risk per day trade. I aim for 1:1 Risk vs Reward on day trades.

The defined risk for the swing trading strategies is:

4 Steps = 1.00% of the total account value.

4 Steps also equals your maximum risk per swing trade. I aim for 1:3 Risk vs Reward on swing trades.

If you picture the basic risk profile of the strategy this is what it looks like.

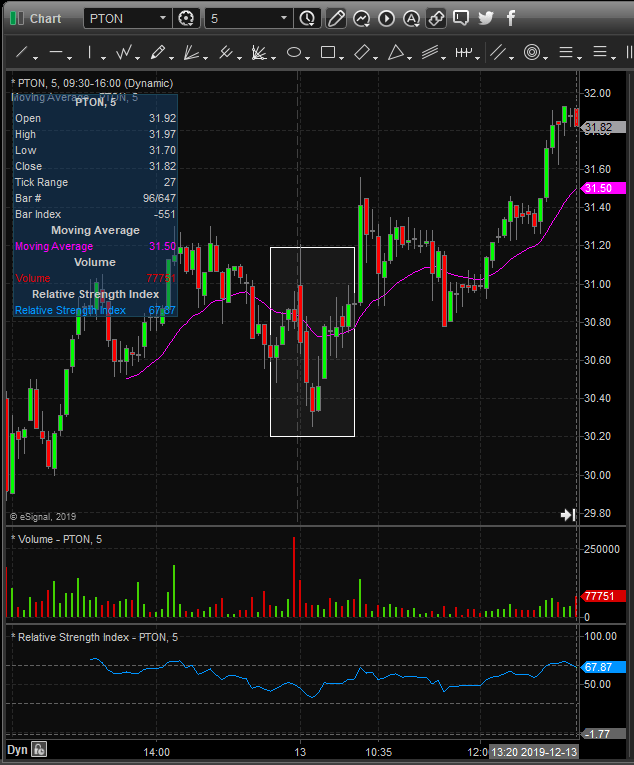
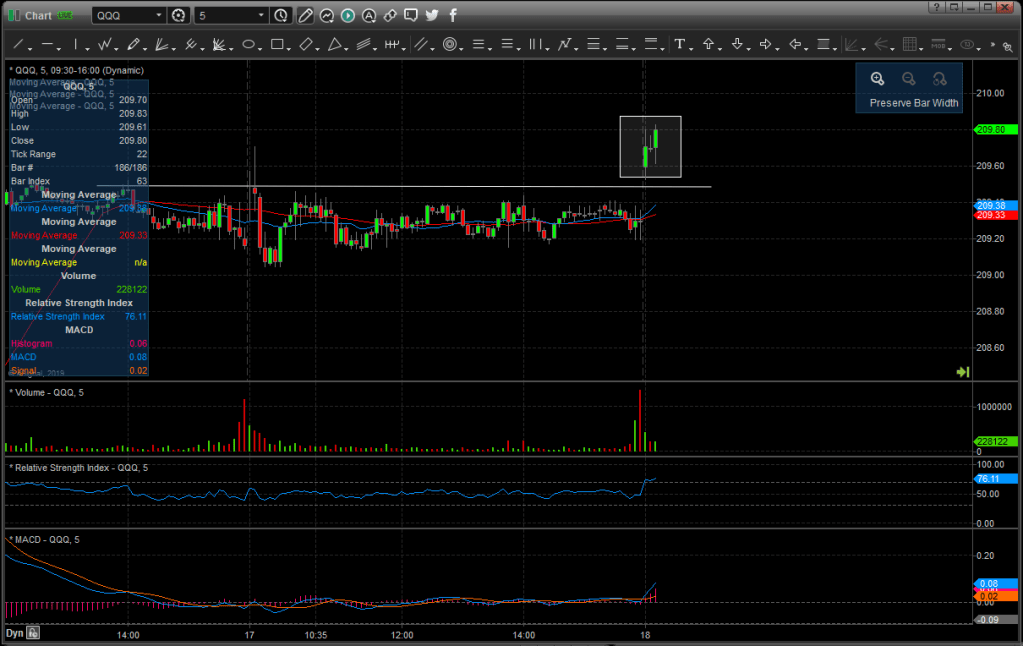
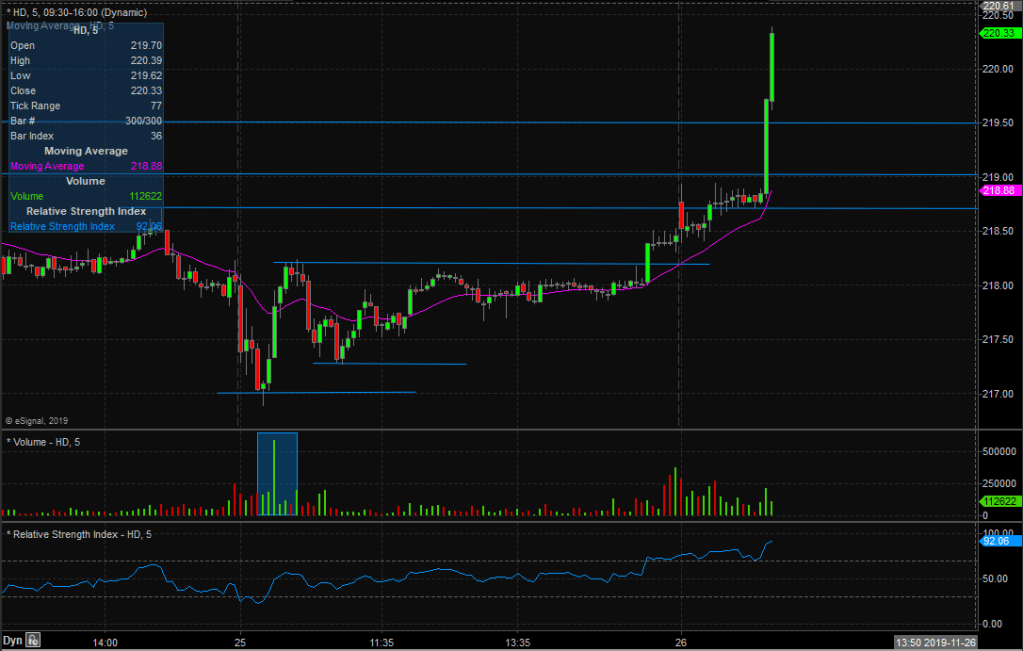
Each day I come into the market I’m looking to build steps through day trading. My goal each day is to build 2 – 3 steps through day trading. As stated before, each one of these steps is a defined percentage of the account which is obviously equal to a dollar value. Let’s assume the dollar value is $500 per step. (This is scalable with the account, for example of the account was $400k in size each step = $1k risk). The types of day trades I look for are Red 2 Green moves, Green 2 Red moves, avalanche trade setups and opening range breakout trades. I also focus on intraday support and resistance levels for trading choppy ranges in range bound markets. This is all done on 5-minute time frame charts.

I size the day trades around 25% of the account value, and on average I look for 1% +/- moves. If the day trade pops quickly, I size out half immediately and then set my stop to the entry price. My goal is to net money with these strategies. I take money from the market as soon as it makes it available to me. I’m very aggressive with this. These short-term day trading and scalping strategies are fast moving. I’m watching the charts and PnL closely. Its important. Some say “rely on the process and remove PnL from the screen” guess what, it doesn’t work for this!!! You have to be quick, nimble and open minded or else I can almost guarantee you; you won’t consistently make money doing this.

The purpose of the day trading strategy in trending markets is to create a cushion for your swing trading trades. Day trading doesn’t present any over night risk where as swing trading does. Your day trading profits reduce your overnight risk as you’re using the intra-day gains to cushion the swing trade. When the market is range bound, choppy or higher volatility your primary focus becomes this day trading strategy and you stop swing trading.

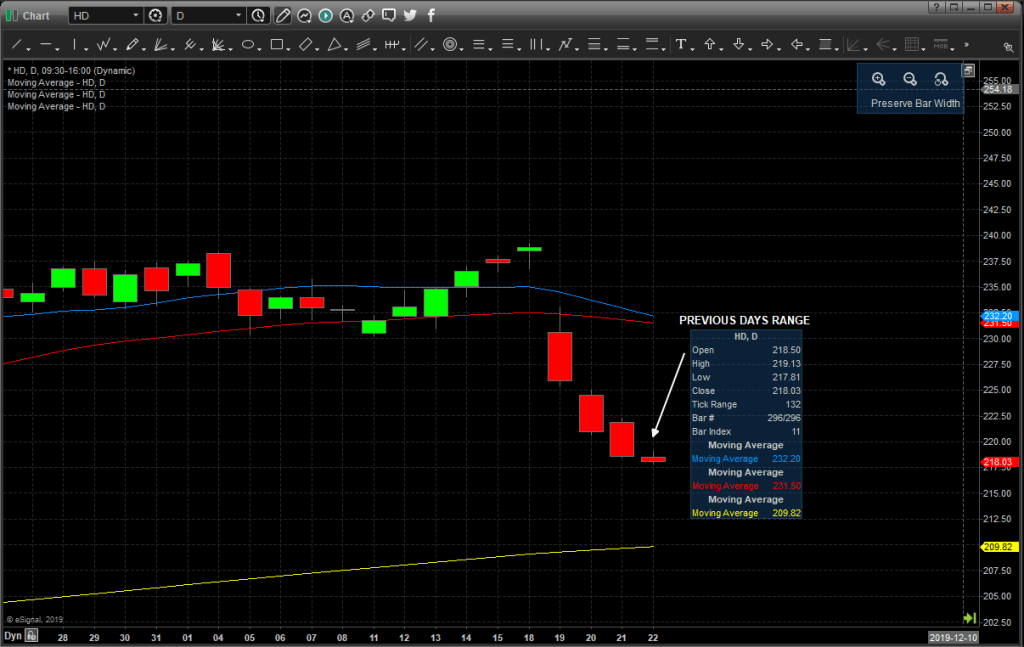
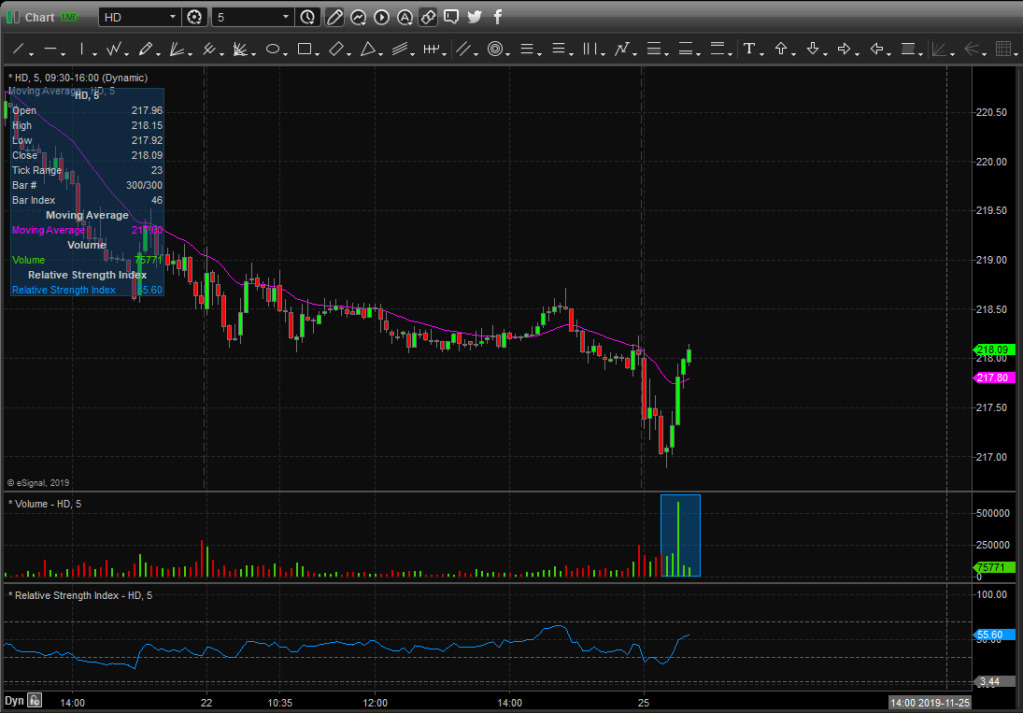
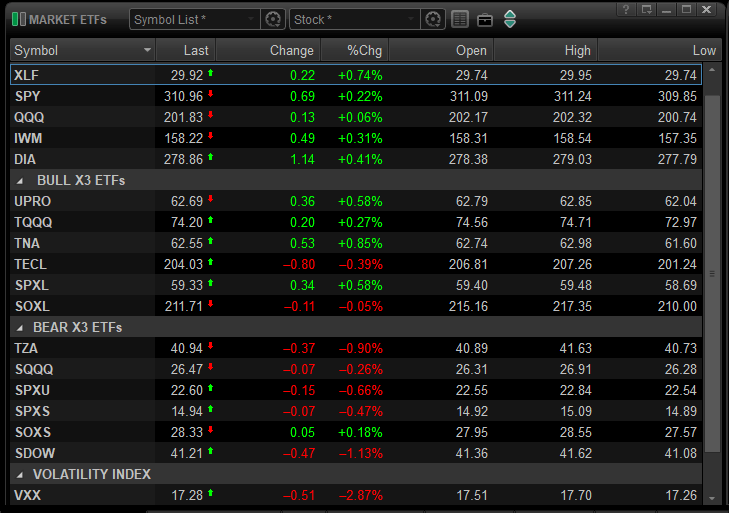
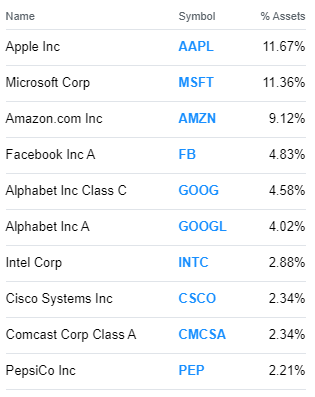
The swing trading strategy is built around Trader Stewie’s Power Earnings Gap system. I’m looking for the strongest stocks in the market to swing trade. Usually, I’m only holding around 2 swing trades over night in a trending market. Names like $TSLA, $AAPL, $NVDA the BEST of the BEST. I also swing leveraged ETFs such as $SPXL, $TQQQ and occasionally $TNA. Again, I’m using my day trading gains to cushion my swing trading positions. In strong trending markets I will treat my initial buy in on my swing trade as a day trade. Looking to reduce half of the exposure as soon as I can with a slight profit to reduce over night risk, and to take money from the market as soon as it makes it available to me. I use 5-minute time frames for the entry then I map out support and resistance levels on 15/ 30/ 60/ and daily time frame charts. I Closely watch these price levels that I map out to see how support and resistance is acting. As soon as I can minimize downside risk through profit taking, I do and then I raise my stop loss to breakeven.

To summarize the strategy into point form it looks like this:

Day Trading component:

  • Take day trades each day with 0.25% (1 step) account risk exposure and look to make 1 step.
  • Aggressively take profits on day trades and reduce risk as soon as possible through profit taking
  • Aim for 2-3 steps a day in order to reduce down side risk on swing trades.
  • In markets with heightened volatility, choppy conditions, day trade only. No overnight exposure.

Swing Trading component:

  • Use the biggest market cap power earnings gap stocks as a focus list
  • Size the trade with 1.00% account downside risk (4 steps) and look to make 10~ steps.
  • Reduce the trade by half as soon as the downside risk is covered.
  • Use day trading steps in order to cover overnight risk on the trade.
  • In markets with heightened volatility, choppy conditions no swing trading. Day trade only.

I’ve been deploying this strategy I’ve outlined here to a single account since January 2019 (I have other accounts but this one has been my primary focus) Here are the results.

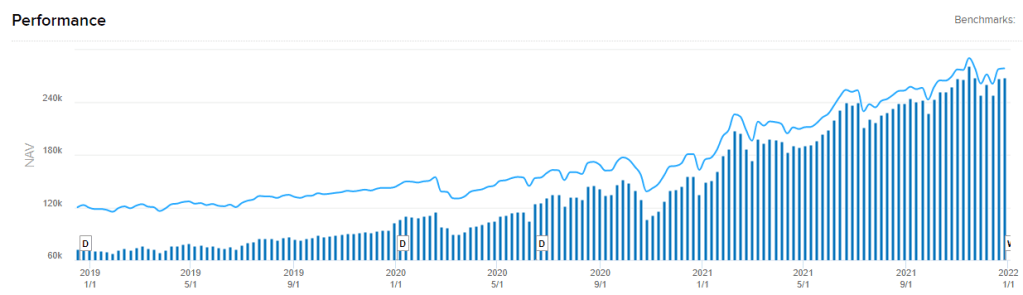
This year was the year when my Stair Trading Strategy (S.T.S) Really shined. I think in part this was because I had the working capital to be aggressive with it, but I also knew exactly what I was trying to accomplish. I stuck with it and it paid.

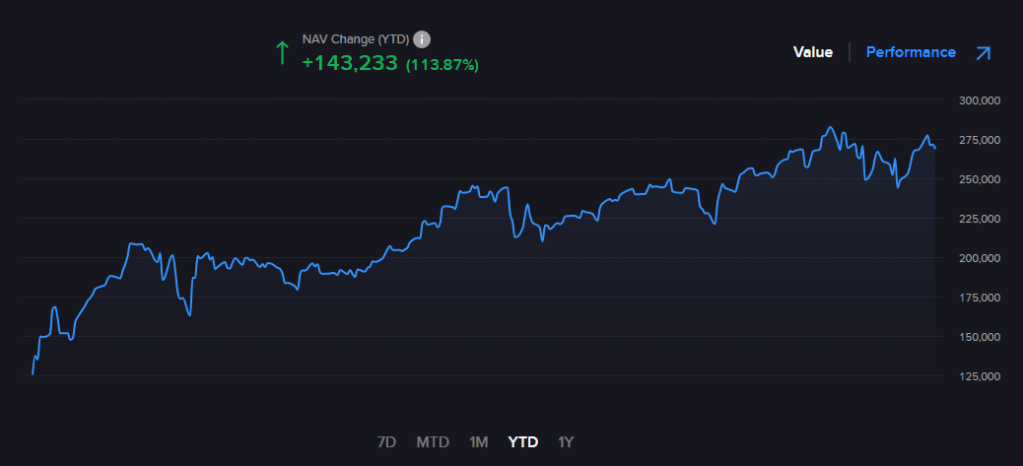
I think the biggest take away from this is, I was actively day trading momentum stocks January through mid February but I was deploying my rules, and taking money from the market when it was made available to me.

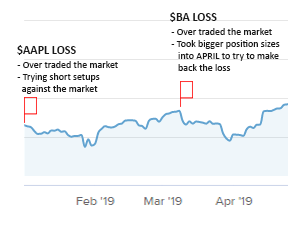
I had a few bumps a long the way, but for the most part I kept things in check and traded my way back into highs each time. Moving forward, I think I need to become better at identifying short term tops in the market quicker so I can move into my day trading component of the strategy a little quicker. My results would have been better this year if I identified these conditions sooner.

A few side notes about my strategy. I also have max daily drawdown rule which sits around 2% of the total account maximum. Occasionally as traders we get caught in bad trades or we’re sloppy in our approach. THESE THINGS HAPPEN. Identifying the problem before making it a bigger one is key. I also have a 2% account increase rule where if we’re in choppy conditions but some how my daily execution is perfectly executed, I will take the gains and move on.

I would have never been able to get to this point trading on my own. The Art of Trading took me from an average day trader to the point in which I could take multiple strategies and combine them into my own hybrid strategy that produces REAL WORLD consistent results. I’m happy to share these results because they’ve made a positive impact on my life, and it shows that hard work and dedication really pays off!

Happy New Year and all the best in 2022!

Featured

Multiple Perspectives – The Art of Trading

How the Art of Trading Facilitated my Growth as a Trader!

I’ve been trading the financial markets for the better part of a decade now. As with most things in my life, I took trading on with a head on approach. The biggest draw to trading for me in the beginning was the individualism and head room for literal unlimited personal expansion and development. I’m a strong believer that the markets can’t actually be mastered on an individual level but with enough experience and practice you can become a very skilled consistent individual. One of the biggest regrets I have about my first few years in trading was grinding away countless hours in my humble home office trying to find my way. This time “alone” wasn’t completely wasted as I acquired screen time and tape reading skills. I’ll highlight my timeline as a trader

As you can see, the first 4 years of my trading was sort of a discovery phase. I work a full-time job (and still do) So in the beginning I lacked dedication, skill, and knowledge. I thought the markets would be something I could master with screen time. 2010 – 2012 I was trading through ERs, non existent risk management etc. 2013 I realized I needed to make a change so I started digging into technical analysis, Candle stick charting etc. As 2014 approached I finally started understanding the importance of timelines, entry and exit strategies and risk management. This was my first profitable year in the market! It took me the good part of 4 years to turn a profit. This is where my dedication to the markets and acquiring trading knowledge started to ramp up.

2015 I focused on my tape reading skills. I was spending almost every spare moment trying to understand the flow of the market. 5minute / 15minute / 30minute / 60minute into Daily time frames. I watched the market like some people watched sports. I was trying to get a feel for the timeframes that best fit my style as a trader. As 2016 rolled around I started to focus on the time frames I could trade best. Using technical price levels, I found success trading small ranges and scalps. This was my AH-HA moment. At this point I was 3 straight years in the green. I started to develop my own style and I was feeling great about being in the markets. I wanted to continue the streak into 2017.

2017 was a great year for my trading. I was following rules, generating profits and this is the first year I actually felt like a “trader”. This is the year I started to realize my stubbornness as a “solo” trader, cooped up in my home office for endless hours each day might be hindering my performance as a trader. 2017 felt almost too easy and I started to realize I might be slightly plateauing in my abilities. I wanted to seek outside help. I needed a mentor!  

                I decided to join Trader Stewies private service at the start of 2018 – The Art of Trading! I was able to incorporate my day to day style with his daily swing trading setups. The biggest advantage in joining this group was, I was no longer spending countless hours trying to find setups to trade. This gave me more time to focus on my craft. Along with joining his private group, I was also introduced to an incredible group of skilled traders. Showcasing their technical analysis skills and techniques gave me that outside perspective I had lacked trying to do this trading thing myself all the years prior. Aside from the great community and daily trade ideas and alerts I was introduced to a plethora of educational content. Trader Stewie has built up a portfolio of blog style trade reviews and charts over the years. Looking back on all of this content I was able to fill the gap in the knowledge I was seeking. What I should have done from the start of my journey was seek out a coach of sorts. I mean, it would have only made sense. All of the worlds top athletes have them. Why not traders too?

What have I gained from The Art of Trading?

  • A different perspective than my own that I can mesh with my trading style.
  • A Community of highly skilled and enthusiastic traders to communicate with.
  • Daily trade ideas, market commentary, and trading alerts.
  • Knowledge I wouldn’t have otherwise learned if I was still trying to trade “alone”.
  • A large portfolio of previous trades (good and bad) to study and work off of.
  • More free time to develop into the trader I want to be.

Here is a sneak peek of one of the educational content videos that was made recently. These educational posts are usually sent via email in a PDF package. With educational market reviews and usually a video to go a long with it.

Video Link – The Cycle of Emotions: Charting Emotions in the Market!

                I hope this blog post is of value of aspiring traders new and old! I think its best to put things into perspective and share where you’ve came from and where you want to go. This was just a small glimpse into my day to day trading and where I came from. The Art of Trading over the last 2 and a half years has really allowed me to come into my own as a trader and I can’t thank Trader Stewie and the community in that group enough. I have to give credit where credit is due!

Featured

2019- A Year in Review

“Every trader has strengths and weakness. Some are good holders of winners, but may hold their losers a little too long. Others may cut their winners a little short, but are quick to take their losses. As long as you stick to your own style, you get the good and bad in your own approach.”

-Michael Marcus

I want to start this blog post out and give you a little insight into the day in the life of myself. I’m in my early 30s. I have a full-time job with very demanding hours, I work shift work, 2-week rotating shifts, days and nights. When I’m on night shift I’m able to trade the markets from open to close. Any free time I have outside of work I dedicate to the markets and my trading. I think I can confidently say my trading has turned into a second full time job. I will continue to dedicate myself to the markets and the refining of my trading skills until I’m able to achieve financial independence and ultimately become a full-time trader. Overall, 2019 turned out be an incredible year for me as a trader. I want to thank everyone who made that possible, especially Trader Stewie and the AOT community. I continue to grow as a trader each and everyday. I wouldn’t be at this point in my trading career if it wasn’t for the support of this incredible community, so thankyou!

Now let’s take a look at my 2019 year! First, we will start with the goals I laid out in 2018 going into 2019. I’ll list my achievements from 2019 and then we will transition into the challenges I faced as a trader and how I over came them.

Here are the goals I laid in 2018 going into 2019. I followed these rules according to plan. I broke my trading performance down into two categories. I tried to highlight everything that had held me back, or had potentially cost me money in the year of 2018. You have to be honest with yourself. I’ve organized these weaknesses into two categories. Internal and External factors. I’ve categorized anything under internal factors that might be considered skill sets or something that might take more practice, and time as a trader to develop. Anything under external factors is something that is directly controllable now, and in your power, to change immediately.  I’ll list some of the things that I’ll be working on and changing for 2019.

Internal Factors:

  • Always sell gap ups. PERIOD!
  • Using mapped out levels on the 5-minute chart, use market limit orders to enter day trades
  • No more than 2 day trades a day. 4 failed day trades in a week = STOP.
  • Don’t be afraid to use weekly options to mitigate risk when trying to play short term market reversals
  • Feeling uneasy or burnt out? Take a break. Clear out all positions
  • $1000+ gain in one day. Sell positions. Take the day off.

External Factors:

  • Switch to a broker with more flexibility in terms of advanced trading options. (Trailing stops, faster and easier execution of market orders, after hours trading etc….)
  • Trade directly from my trading software. (Faster, more control)
  • Upgrade my trading arrangement (New desk, Monitor, Chair. Make it feel more professional)

With these rules I set out in 2018 for 2019 I was able to define consistency and turn out a great year. I was able to beat a market that in my opinion was easier for investors than it was traders. The slow methodical grind higher and the low VIX environment didn’t create that many opportunities and when it did, they were very few and far between.

Let’s take a look at some of my achievements for 2019. Then we will examine some of the challenges I faced as well as reviewing the year as a whole.

2019 Achievements:

  • Stuck to my rules. Rarely deviated from the plan!
  • First trading year with two 5 figure months!
  • $APC Buyout which I bought the Friday before. (Biggest 1-day gain of the year +$5100!!!)
  • Closed the year out slightly beating the market. 31% gains.
  • Severely lagged the market the first 6 months. Through determination and process beat it by year end!

2019 Challenges and Yearly Trading Review:

2019 for me could probably be defined as a year of emotional management. As a trader, letting emotions get in the way of your trading can not only hinder your performance, it can potentially break you. In my opinion 2019 was a very hard market to trade from a swing trading perspective. The low volatility and slow grind higher made it difficult to manage positions effectively. It was definitely an investors market. That paired with the massive sell off in December 2018 it made it very hard from a emotional standpoint to want to be heavy long in the market from January into March. This Bias killed my first quarter of 2019. The biggest emotional obstacles I had to over come in 2019 were two unexpected BIG gap down losses in mega market cap names. The first of which was $AAPL and then shortly after $BA. I generally size my trades a little bigger when it comes to companies with a proven track record and stability in the market so these losses really stung. We will review those and how I over came them in this post! On a more personal note I lost my Grandfather in late August. I spent almost every other day with him, at his home from April up until his passing in late August. This was one of the toughest times in my life.

Let’s take a look at my equity curve for 2019 and pin point the defining moments.

Basically, the first trading day of the year I took a substantial loss on Apple. The stock was halted after hours and they warned on an ER miss. This was probably the worst way I could have started my year off. In the weeks to follow I over traded the market (mainly short) and gave back even more. I couldn’t get over how quickly the market sold off in December and instead of following the flow of the market in January I traded against it. Costing me dearly. As you can see from the infograph I switched gears in February after reviewing my own stupidity and made back all of the previous $AAPL losses plus a bit more.

I was positive on the year at this point. After gaining momentum I sized up on a $BA swing trade the Friday before the big news hit. Taking another massive hit and eventually sending me back into late January lows.

April I really concentrated on smaller size positions and gaining some ground back in the market which I did. The $APC buyout around this time really helped that out.

From May into late June I stuck to my trading plan but my setups just were not working. All traders go through these stale periods. I could have probably looked for more day trades during this time but I was being extra cautious during this period so I just stuck to my plan and didn’t really change anything. Its important to stick to your plan during these phases. Changing methods can cost you dearly.

July into August I had a phenomenal month. I closed out 33 trades this month of which 27 were winners! One of my best trading months ever as well as some of my biggest days. Everything during this period was firing on all cylinders and I felt confident again. I used caution September through December this year to hold on to my gains and eventually slightly beating the market by year end!

6 Month Run July 2019 – December 2020

What I Learned as a Trader in 2019:

                I learned a few big lessons in 2019 that will stick with me for the rest of my trading career. I think the biggest lesson out of all of it though is to never carry a bias. I already knew this from years past but it was my own ignorance that killed my performance in the first few months of the year. The 2 big losses from $AAPL and $BA were completely unavoidable and I can’t fault myself for that. It was what I did after as a trader that allowed me to overcome the situation. I could have probably handled the situation a little better than I did, but that is why I’m writing it down and reviewing it here. So next time when disaster strikes (and it will) I can handle the situation with a little bit more experience and insight! As for the second half of the year I couldn’t be happier with the way I performed. I banked about 25% gains in that period of time and I think that is one hell of an achievement considering the circumstances, my full time job and other personal issues I was dealing with at the time.

2020 Goals:

                I pinned these goals to the top of my Twitter. Let’s review them again. For me I want to make 2020 about consistent month over month profits as well as trying to make each month a profitable one. I think my trading has got to the point where I need to really start trusting absolutely every instinct I’ve developed as a trader and really grind into what I know and executing on it with confidence. I want to achieve a year where I absolutely crush the performance of the overall market. I’m confident I have the skills to do it!

The goals:

  • Streamlined consistent month over month profits.
  • No Red months. Profitable 12 out of 12 months.
  • $50K+ Gains for the year of 2020. ~$4K a month average.

I think its very important as a trader to be completely honest with yourself and define what you want. Trading isn’t easy, but if you’ve got a plan you can make it a whole lot easier. I encourage you to review your year just as I did and make the necessary changes in order to become the trader you want to become. For myself I want to do this professionally and I wont settle for anything less than that!

                Thanks for reading another one of my blog posts.

I want to dedicate this post to my grandfather! Thank you for a life time of amazing memories, all of the encouragement over the years and most of all for being my number one fan! I know you would want nothing more than me to continue to kick ass in the markets. I promise you I’ll get there. My fucking word Grandpa!

Featured

Setting Up a Space for Trading

Computers, Displays, Software, Desks and More!

If you’re an active trader, you probably spend a lot of time around your computer charting, researching, watching the markets and trading. You’re probably in this space for a long period of time, you might as well make it as comfortable as possible, enjoyable, and well, fun to be in. If the space you create is something you enjoy being around, your day to day emotional state is probably going to be in a pretty good spot! We know that proper emotions and consistent trading go hand in hand! In this blog post we’re going to focus on setting up a productive work environment and I’ll go over how I’ve set up my space, the computer, displays, software, my desk, and a whole lot more!

                First off, I’ll give you a bit of background on me, before I started trading. My father had taught me how to build computers between the ages of 13 – 14. To say I was obsessed with technology would be an understatement. This was early 2000 – 2001. Computer hardware started becoming more readily available to the public, stores like Future Shop were thriving, computational breakthroughs were rapid and “High-Speed” internet was becoming more accessible to the general public. In my opinion this was one of the most exciting times in history for anyone interested or involved in technology at that time. My first job at the age of 15 was actually at a local computer store building / fixing PC’s. Now 18 years later I’m 32 years old and I’m just as involved in technology as I was back then. You could call me an “enthusiast.” I’ve taken this skillset and have applied it to my trading. Whether its building the computers I use to trade, or streamlining functionality that I use in my software, I try to apply this skillset in some form.

I’m going to break down this blog post into 5 sections.

  1. Computers:        What I use and some suggestions on what you might need.
  2. Displays:             The displays I use and the reasons why.
  3. Software:            The software and broker I use and how it puts me “in control.”  
  4. Desk:                    My desk layout.
  5. Final thoughts: Just general thoughts.

Computers:

Ok so let’s get started on the computer side of things. I think most traders / investors that don’t have a background with technology automatically think they need to have the latest and fastest technology they can get their hands on in order to be an efficient, competent trader in the markets. This thinking couldn’t be further from the truth. In most cases you don’t need the latest and fastest hardware available. You can easily get away with a higher end Intel i5 processor, 8GB of ram and decent graphics card. I’ll list what I’m running and then I’ll have you a link to decent prebuilt PCs that you could buy if you’re looking for an upgrade.

My trading computer specifications:

Motherboard:           Asus ROG B250 

Processor:                   i7 – 7700k

Graphics Card:           MSI R9 380

Ram:                              16Gb gSkill TridentZ DDR4 3200

Storage:                       256Gb Samsung 960 Evo M.2

The system listed above is a computer that I put together myself. Now I don’t want to make this blog post about building your own PC because I figure if you’re reading this, you already know how to build a system and if you don’t, you’re most likely just looking for suggestions for a new PC. What I listed above should be a good base to start. I can accomplish any task that I need to do with that particular setup. I can run 3 high resolution displays with 4k content playing on one monitor trading software in the back ground and applications such as Adobe Photoshop or Adobe Premiere all running at the same time without a single hic-up. That and with the high-quality hardware used for the build I can depend on this system day after day, year after year.

If you’re looking to buy a new prebuilt PC, I suggest some of the prebuilt systems Lenovo has to offer. The C-series Legion PCs have great hardware and pack a lot of punch for a budget friendly price tag. You can find these Prebuilt PCs here. I like the Legion C530. Best bang for your buck in my opinion.

https://www.lenovo.com/ca/en/desktops-and-all-in-ones/legion-desktops/legion-c-series-cubes/Lenovo-Legion-C530-19ICB/p/99LE9500313

*Another thing to consider is hardwiring your internet connection. That way you can guarantee stable, consistent connectivity and if you do lose connectivity you can quickly trouble shoot the problem. I always hardwire my connections to my PCs. One more thing to note is I always have a USB cable readily available to plug my phone into if I lose my main connectivity and need to tether my phone for a temporary backup connection.  

Displays:

                When it comes to displays, I think this is one of the biggest items a trader over looks. In my opinion most consumers generally look for the lowest price displays with the highest resolutions and the biggest display dimension. In my opinion this is the exact opposite as to what you should be doing. What you want is a high quality display that is easy on the eyes, a display that isn’t so big that you need to be looking all over the screen to find the important information that you’re looking for and a resolution that isn’t so high that you find it difficult to read the text on the screen or see small details. Now mind you this is just my opinion but I think you’d be hard pressed to find a display that checks off all the boxes for trading better than the ASUS PB278Q. These displays are incredible and I’ve been using them close to 8 years now. You can read more about this display here: https://www.asus.com/Monitors/PB278Q/

ASUS PB278Q Pros:

  • Very easy on the eyes. Read more about “Asus Eye Care Technology” here: https://www.asus.com/Microsite/display/eye_care_technology/
  • 2560 x 1440 Native resolution. Sort of the sweet spot between 1080p and 4K resolution. Text and on-screen information (stock charts) very easy to read without having to scale text / layouts.
  • Virtually no flicker. These monitors are flicker free.
  • Amazing visuals. These are professional grade displays so expect consistent, vibrant colors.
  • The out of box stand is very well built and allows for easy up/down adjustment, tilt and even swivel if you want to set the display up in a 90-degree configuration.

I run two of these displays side by side.

You can find the ASUS PB278Q displays for sale here: https://www.amazon.ca/ASUS-PB278Q-2560×1440-DisplayPort-Monitor/dp/B009C3M7H0

I also run a 3rd display which I use for general day to day activities. Such as excel sheet inputs, photoshop work, writing these blogs, playing video games etc. This is a 4k display also built by ASUS. The Asus MG28UQ. It fits in nicely with the PB278Qs and it was a great addition to my workspace. I don’t necessarily recommend this display for every day trading though. Its much better suited for what I listed above.

You can read more about the ASUS MG28UQ display here: https://www.asus.com/Monitors/MG28UQ/

You can find the ASUS MG28UQ display for sale here: https://www.amazon.ca/Asus-Freesync-MG28UQ-Response-DisplayPort/dp/B01BYU0GVC

Here is a picture of how I have the displays laid out on my desk.

From left to Right. PB278Q / PB278Q / MG28UQ

Software:

        For my day to day order execution and trading I use eSignal synced with my Interactive brokers account. I can place orders in real time right from the charts in eSignal. Part of the reason I like this is because I both swing trade and day trade as part of my overall strategy. With eSignal I can almost instantly (within the click of a mouse) execute buy and sell orders within the software. The software has a plethora of capabilities and it fits well with my overall strategy. Read more about eSignal here: https://www.esignal.com/index

Here is a couple of screenshots of how I have eSignal laid out across my Asus PB278Q monitors.

Now on to my broker. Interactive brokers. I’ve been with other big brokers in the past and as far as I’m concerned Interactive Brokers is hands down the best. My orders always fill, I can get in and out of positions at any point in the day whether its Pre-Market or After-hours and being able to sync all my accounts with in eSignal makes my trading very streamlined and efficient. When I trade with Interactive Brokers, I can be confident I’m going to get the experience I want and require. Learn more about Interactive Brokers here: https://www.interactivebrokers.ca/en/home.php.

Last but not least. Trend Spider. Trend Spider is an incredible browser-based trading platform that I also use on a day to day basis. When I’m at work or away from my screens at home I know I can log into their software to check charts, alerts, get real time quotes etc. Definitely an awesome solution for those who can’t always be around their system at home. Learn more about trend spider here: https://www.trendspider.com/

Desk Setup:

                Have you ever wondered what the desks of other traders on FinTwit look like? Here is a picture of mine. I have a basic L-Shaped desk that fits my monitors properly, plus gives me a bit of room on the side to write down notes and accomplish other tasks. Maybe reference some old trades or read a book during the trading day. Whatever it might be I have room for it.

You can see my general charting layout and how I use the 4K monitor on the side for other things during the trading day.
Gives off an awesome vibe at night too.

Final Thoughts:

Thank you for reading another blog post and I hope the information I provided about my personal setup can assist you in setting up a space that works for you! One of my favorite rooms in my house is my home office, I really enjoy hanging out in this room. It makes trading all that much better! One recommendation I would make is if you’re new to trading I wouldn’t go all out on a setup in the beginning. Learn the basics of trading, the time frames you enjoy trading and so forth. Your trading setup should fit your style, not anyone else’s. Trading is a very personal thing so should be your setup and space!

Featured

$PTON: R2G

$PTON: Front Running the Red to Green day Trading Strategy

                A Little over a week ago now I executed what I consider a very nice Red to Green (R2G) day trade in Peloton $PTON. I executed this trade in a 40-minute time span using the 5-minute charts for a cool 3.65% gain while only risking just over 1% on the trade. I was able to squeeze a little more profit out of this trade because I used a modified version of the R2G strategy. Hence the “front running” in the title. With a little home work you can find and execute these trades too! I look for these types of trades on a daily basis to coincide with my swing trading strategy. I would like to go over this trade and show you how and why I took the trade, what strategies, capital management, entry and exits I used in order to nail this sweet trade. Let’s go over those now!

                When I look for stocks to execute this sort of strategy I used on this trade, I’m looking for stocks with very wide intraday ranges. The reason I’m looking for stocks that can move say 2%-3% on a given day is because if you can get the entry right you can potentially bank a few percentage points in a very short period of time with minimal risk to the capital at hand. $PTON was the perfect candidate because it was making 5%-8% moves intraday. Now that I’ve found a stock that fits the criteria, I want to come up with a solid plan to execute upon. On the daily chart $PTON made huge moves intraday 5 days prior from 2019-12-11 to 2019-12-17. One common factor that stuck out to me was the stock liked to hold the 21-day moving average each of those days. Whether it was at the open or the close of the candle that was the common factor. Obviously, this area was a magnet for support. Knowing this, I want an entry slightly below this area in order to capitalize to the fullest extent on a reversal higher.

The second factor was this stock from 2019-12-13 to 2019-12-17 made massive moves down in the first 15 minutes of trading and then reversed and moved sharply higher shortly afterwards. Take a look at these 5-minute charts that show the consistency of the morning sell off into a sharp reversal higher!

$PTON 2019-12-13: FIRST 15MINUTE REVERSAL
$PTON 2019-12-16: FIRST 15MINUTE REVERSAL
$PTON 2019-12-17: FIRST 15MINUTE REVERSAL

 The third consideration was $PTON made a very strong move out of its range on 2019-12-17. On that day the stock reversed and continued higher on very strong volume for the majority of the day. I knew my best shot at a high probability explosive R2G trade was going to be on 2019-12-18 based on the fact that it finally made a move outside of the range from the previous 5 trading days. I decided that my entry target was going to be a retest of the top of that range $32.

 In summary the 3 key factors that helped plan out this trade were as followed:

  1. The stock made massive intraday moves usually finding the 21 day as key support.
  2. The ideal entry for a reversal higher should take place within the first 15 – 25 minutes of the trading day.
  3. An initial entry at or near the $32 area would be ideal on 2019-12-18 for a ***R2G DAY TRADE! This area both coincided with the top of the previous trading range and also landed right near the 21-day moving average. An area we identified as strong magnet in the previous charts.

The Trade Execution

On 2019-12-18 my eyes were glued to $PTON. The market had set up as close to perfect as it was going to get for me to execute on this idea. Let’s take a look at a 5min chart of that day. We will review the first 15 minutes of action of $PTON that morning and compare it to the market overall.

$PTON 5 Min chart 2019-12-18: First 15 minutes of trading:

As you can see $PTON quickly sells off as it did the previous 5 days almost right at the open. Also notice the RSI is getting into oversold territory. I then quickly look at the QQQ’s. What I notice is a very promising and bullish development. You will notice that the QQQ’s had two previous very tight range trading days but on the 18th the QQQ’s gapped up and started climbing quickly. I figured if $PTON was going to reverse it would surely end up following a long with the market. The likely hood of this trade working out has increased significantly because of this *If the overall market was RED that day, I wouldn’t have tried this trade. At this moment I decided to take the trade.

QQQ 5min 2019-12-18: Opening gap:

The trade was the easy part so I’m going to sum all of that up into a single chart. My next step is to wait for a green reversal candle and put in a Limit Order to fill the first part of my $PTON trade. This is part of the strategy. For a trade like this I’m not going to go all in before I get some confirmation on the trade. So, I went in 200 shares at $32. Even though I could have got in lower I wanted to buy the support area not anything below it. My next step was putting in a stop loss. My stop loss was at $31.50. Why? you might ask, well this was the big breakout spot from the previous day. I didn’t want to see it go below that area and on 200 shares I was only risking $100 on this trade. Very conservative on the risk. My next step was to look at the chart for my next order to fill. When will I add to this trade if it starts going in the right direction? I decided the $32.45 area was a good area for reversal confirmation so almost immediately I put in another order at $32.45 for 250 shares. Where do I go from here? Well I knew from the previous 5 days I have a 30 – 45 minute window to capture a reversal. Most days the stock reversed about $1.00 – $1.50 from morning lows before calming down. I was in 450 shares at $32.25~ So my target was anywhere from $33.25 into $33.75. I also knew I should expect a big push when the stock went green and subsequently after it cleared the previous days high around $33.35. I ended up selling the stock at $33.46 approximately 40 minutes after the initial entry.

In summary here were the steps of the trade:

  1. Watched the stock sell off the first 15minutes as the overall market began to breakout.
  2. Put a Limit order in at or above $32 @ 200 shares after the first 15 minutes.
  3. First order filled at $32.00 ~200shares.
  4. Placed stop loss at $31.50 (Previous days breakout spot)
  5. Placed another limit order at $32.45 (Pivot for reversal)
  6. Raised stop to $32 after the $32.45 order filled (Risk now sits at $170~)
  7. $PTON gains some more strength around $32.90ish (Where it goes GREEN)
  8. After $PTON goes green it pushes higher by $1 in 5 minutes.
  9. Stock runs +++$1.50 from lows
  10. SOLD AT $33.46! 4 cents from the TOP TIC of the DAY!!!

For a trade like this you really have to understand the price action of the stock. That’s the reason I spent so much time explaining the setup at the beginning and then spent less time on the actual trade. When I execute a trade like this I’m thinking fast and using my experience in the market in order to make the decisions. Sometimes you don’t have time to think before you act. In this particular trade $PTON gave just under 10minutes for an entry and less than 5 for an exit. I was able to bank $410 USD on this trade in a 40-minute time frame. That’s roughly $650 CAD. If you can find and execute on a setup such as this once a week you can substantially add to your bottom line at then end of the month!!!

I hope this day trading summary helped you gain some insight into the way I play trades such as this!

Featured

Trade of the Week!

HOME DEPOT STOCK [$HD] BOUNCE PLAY

One of the most helpful things that anybody can learn is to give up trying to catch the last eighth—or the first. These two are the most expensive eighths in the world.

Edwin Lefèvre, Reminiscences of a Stock Operator

Spotting Reversals for “Oversold” Bounce Plays!

One of my favourite trade setups is an oversold bounce play! This week Home Depot ($HD) set up beautifully for such a trade. I had been stalking the $HD chart the previous week waiting for the setup to develop into a high probability trade. In this week’s blog post, I’m going to show you all of the factors I considered going into this trade, how I traded it from start to finish and a critique of my own trade and what I could have done better! This was also an official AoT trade alert! I’m sure many of the members of this awesome community enjoyed this trade as well!

            Calling tops and calling bottoms is a very dangerous thing to do in the market, so when I take a trade such as $HD there are many factors that must line up for me to fully commit to the position. Here are the following items I check off the list before I commit to the trade.

  1. Is the stock still respecting its upward trending support?
  2. Is the stock at or near a big area of previous MAJOR resistance?
  3. Has the volume on the down days slowly started to dwindle down?
  4. Is there a technical setup emerging on the chart? (falling wedge)
  5. Was the previous days trading range nearly flat or muted?
  6. If I enter this trade can I put on a reasonable stop that will allow the trade to breath but at the same time responsibly protect capital if the trade quickly goes against me?

Let’s analyse all of these questions one by one!

  • $HD Daily chart – Is it respecting major uptrend support? YES!
  • $HD Daily chart – Is the stock at or near a big area of previous MAJOR resistance? YES!
  • $HD Daily chart – Has the volume on the down days slowly started to dwindle down? YES!
  • $HD Daily chart – Is there a technical setup emerging on the chart? YES!
  • $HD Daily Chart – Was the previous days trading range near flat or muted? YES!
  • If I enter this trade can I put on a reasonable stop that will allow the trade to breath but at the same time responsibly protect capital if the trade quickly goes against me?

For trades like this I generally scale into the trade. I start by putting on a half size position and then when I’m sure that a reversal might take place, I add to a full-size position. My stops are usually about a 1% risk from my entry. In this trades case I had an average entry around $217.80 and my stop was a respectable $215.

With this information at hand you might ask: What triggered your entry into the stock and how did you scale into the trade? Let’s take a look at the process behind the entry!

The Entry!

            I like to use 5-minute time frame charts to enter stocks. I think they provide all the confirmation a trader needs to enter a swing trading position! A few factors I considered when entering the trade were:

  1. Did the stock open down (red)? Is it starting to reverse? (Red 2 Green setup)
  2. Upon the reversal did the stock see a BIG spike in unusual volume?

In this case $HD did! Let’s look at the point in which I entered this trade!

$HD 5 Minute Chart – Big Volume Reversal (2019-11-25):

The stock opened red, sold off the first 30minutes of the day and then a massive spike of volume (500k+ shares!) the stock reverses and goes green 15minutes later!!! Remember some of the best trades are ones that open RED and go GREEN! I took a half size position at this point and set my stop at $215! Here is a screenshot of my first entry here:

First Entry $HD Stock:

After entering the first position in the stock, I put in a second small size limit order for when the stock went green! I wanted to scale into this stock fast on any signs of a reversal. Here is the second entry for when $HD went green!

Second Entry $HD Stock:

As the day progressed so did the chart, in this next chart, we will see how the stock puts in a higher low!

$HD 5 Minute – Chart higher low (2019-11-25):

At this point I had bought the 3rd and final piece of my position! I was quite confident in this trade so I sized accordingly. Admittedly I could have waited for a bit more confirmation on the higher low.

Third Entry $HD Stock:

At this point I was fully scaled into the trade with 150 shares with a cost average around $217.81. Seen here:

So, what is the next step to this type of trade?

First, I take a look at my overall target! I’m generally not concerned with making money at the start of the trade, my main concern is protecting capital. But as many traders know, you have to have an exit strategy on both sides of the trade whether you’re getting stopped out or capturing a gain. My target on this trade was around $225ish – $226ish range. I actually posted a chart on the Sunday night before (2019-11-24) stating that I was interested in this trade. I had already mapped out levels on that daily time frame using Trendspider Charting Solutions! Click the link to see the chart and levels below!

$HD Daily Chart – Chart Requests Trade idea (2019-11-24):

A link to that thread can be found here! https://twitter.com/87AlwaysRed/status/1198802215265275904

The next step to my trading strategy is to start mapping out more precise levels on the 5minute time frame chart. The reason I do this is because I want to see how the stock reacts at certain “BIG” levels. The second, and frankly the most important reason is because I want to potentially use these levels as future stops on my position! I want to plan a strategic exit before its to late. Keep in mind you must be careful with this sort of strategy though. If your position size is too big you might have a tendency to take the position off early! Let’s take a look at the levels I mapped out!

Keep in mind I mapped these levels out before the stock actually ended up at these points. I use these levels to manage the trade! I use multiple time frames 15min / 30min to find these areas and map them out. Here are 4 charts I posted live throughout the $HD trade:

$HD 5 Minute Chart – Levels 1:

$HD 5 Minute Chart – Levels 2:

$HD 5 Minute Chart – Levels 3:

$HD 5 Minute Chart – Levels 4:

As you can see this trade is following technical levels very nicely! I’m watching the volume levels very closely as the trade progresses! Also if you go back to the daily charts you will notice $HD put a mini hammer reversal in with continuation to the upside on Tuesday!

Ok, so now what? A very important rule I have is to never close a green trade red! So, lets get on to how I exited this trade!

The Exit!

On Tuesday I had raised my stop to the break-even area after the stock closed above $220. My stop at this point was $217.50ish. I was giving this trade approximately a 1% move the whole way up.

Wednesday was the important day though! Premarket the stock was trading at $222.50ish! I knew we were in for a gap up open so this is when I needed to watch close! I raised my stop to $220.50 after the first 30 minutes of the day. As you can see in the previous chart $HD didn’t go below the previous close. It reversed and push into highs of the day before the FIRST HOUR OF TRADING! This is a very bullish sign!!!

At this point $HD pushes higher fast! Pushing into the $222.50 range! I’m planning my exit! Why you might ask? Well here is why I exited the stock when I did:

  1. The stock was pushing into premarket highs – Possible spot for resistance.
  2. We were trading a short week! Volume started to become muted.
  3. Unlike the day before $HDs volume wasn’t as impressive.
  4. I was nearly 2:1 on the trade! It never hurts to lock in profits

Lets take a look at the exit chart!

I took the trade off at $222.20 for $4.40 a share or a $660 USD gain. I’m a Canadian trader so I banked $875~ CAD after the currency conversion!

EXIT:

Why did I take the trade off when I did?

  1. I was within 1% of my target! My Stop loss was 1% lower. At this point it really didn’t make sense to risk 1% to make 1% I was better off just capturing the gain!
  2. It was a short week in the market! NEVER TRUST A SHORT WEEK IN THE MARKET!

What could I have done better?

  1. On the entry I should have waited for a bit more confirmation on the higher low!
  2. On the exit I should have used the clear trendline it was following to capture more of the gain.

Thanks for taking the time to read how I executed this awesome trade! I hope this post gives you a little more insight as to how I handle my positions as a trader! Happy trading!!!

Featured

Market Scans – Quick & Easy

Scanning Market ETFs to Create Actionable Watch-lists

One question many new traders ask is “how do I find tradeable stocks in the market?”, “What do I look for?”, “Where do I find the stocks that lead the market?” The answers to these questions might be much simpler than you think!

A quick and easy method I use to scan the market for leading stocks is through market Exchange Traded Funds (ETFs) Many ETFs have done the hard work for you! These funds usually contain the best of the best within the holding. In fact, a watch-list that I ALWAYS have on my main screen is a “Market ETF” watch-list. Throughout each trading day I watch these ETFs to see how the market is performing. With this watch-list I can quickly see the strengths and weaknesses in the market! This allows me to see the sectors that are leading the market and the sectors that are weak for the day. This is very valuable information to a short-term day/ swing trader!

Here is a screenshot of my ETF watchlist:

With this information how can you use it to your advantage you might ask? Well the answer to that is very simple! Every night after the market closes, I scan through the TOP 10 Holdings of each ETF! ($SPY / $QQQ / $XLF / $DIA / $SOXL are my go-to!) With that I make watch-lists for the very next trading day. The trick to this though is to wait until the market ETFs are setting up a trad-able pattern. My go to pattern in these ETFs is usually at Bullish / Bearish Flag setup. If the ETFs are setting up a trade-able pattern this is your time to take advantage of a potential edge and execute upon it!

But where do I find the TOP 10 Holdings of these ETFs? These lists can be easily found on finance.yahoo.com.

Step 1: Search the ETF ticker at the top of the webpage.

Step 2: Confirm the search has retrieved the proper ticker you were searching for.

Step 3: Scroll down the page about half way and the TOP 10 Holdings List will be on the right side.

Here is a list of the Top 10 holdings of my go to ETFs:

$SPY TOP 10 Holdings

$QQQ TOP 10 Holdings

$XLF TOP 10 Holdings

$DIA TOP 10 Holdings

$SOXL TOP 10 Holdings

Creating the Watch List

With these top 10 lists at hand I’ll usually scan the top 3 – 5 symbols on each. The beauty of creating a watch-list out of these market ETFs is in most cases you get a well diversified, actionable list with potential trade setups. If you have relative weakness in one sector other sectors may have relative strength the very same day, giving you a potential edge, long or short.

Here is an example of what I look for when creating a list. Let’s focus on $XLF!

Notice how on the $XLF daily chart Is setting up a very nice Bullish flag pattern? Now let’s look through the Top 10 List and see if we can spot a name where we can create a potential edge in the market! Remember as a trader you want to try to outperform the market not match it. If you wanted to just match the performance buying the ETF would be more appropriate!

A quick scan gives us this:

BRK.B Daily Chart:

Take a look at that very nice bullish falling wedge setup on the $BRK.B Daily chart! What makes this setup very nice is although the $XLF has held a tight range $BRK.B ran up quite quickly and then pulled back in a “smart” manner. This setup is ideal because you have a 1:3 Risk to Reward. You’re basically risking 1% to make 3% – 4%! The best thing about this scan was $BRK.B was literally the first scan in the list and you found an actionable setup!

Now I would continue to scan each sector and each list until I had a solid diversified watchlist for the very next trading day. The trick to this, is to wait for the sector to setup as a whole then look for the strongest, most ideal risk to reward setups within the sector lists. NO SETUP = NO TRADE!!!

I do these types of scans nearly daily and quite oftentimes find great setups long and short, through these very simple scans! You can do it too!

*IN NO WAY WHAT SO EVER SHOULD THIS BE TAKEN AS FINANCIAL / INVESTMENT / TRADING ADVICE! This is a place where I keep MY RECORDS!